- Home
- National Debt by President
National Debt by President
How much the national debt grew under each president from Carter to today, with a live counter for the sitting president, per-day averages and the Treasury figures behind them.
The total public debt outstanding is the sum of everything the federal government owes, both to the public and to its own trust funds. This page compares the debt on each president’s Inauguration Day with the debt when they left office, and keeps the sitting president’s figure ticking from the Treasury’s live feed.
Presidents do not borrow on their own: Congress passes the budgets and the debt ceiling, and the economy sets much of the tax take. The ledger is still the simplest way to see the scale of borrowing in each era.
National debt by president
What every president added to the total public debt, from Washington to today, and how fast the current total is climbing.

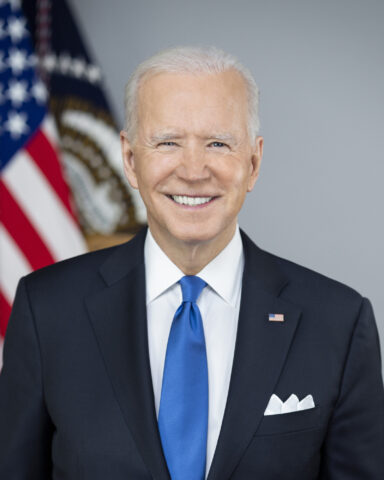
47th president · In office now
Republican · Since January 20, 2025 · Second term, in office now.
Debt on Inauguration Day: $36,218,000,000,000
Added since taking office
$4,114,165,575,511
Growing by — every second · 625 days in office · 11.4% more than on day one
- Total national debt now
- $40,332,165,575,511
- Average added per day
- $6,582,664,920
- Share of all debt added under this president
- 10.2%
Every president
- Added
- $8,466,000,000,000
- Change
- +31%
- Per day
- $5,794,661,190
- Left office at
- $36,218,000,000,000
- Added
- $7,805,000,000,000
- Change
- +39%
- Per day
- $5,342,231,348
- Left office at
- $27,752,000,000,000
- Added
- $9,320,000,000,000
- Change
- +88%
- Per day
- $3,189,596,167
- Left office at
- $19,947,000,000,000
- Added
- $4,899,000,000,000
- Change
- +86%
- Per day
- $1,676,591,375
- Left office at
- $10,627,000,000,000
- Added
- $1,540,000,000,000
- Change
- +37%
- Per day
- $527,036,276
- Left office at
- $5,728,000,000,000
- Added
- $1,490,000,000,000
- Change
- +55%
- Per day
- $1,019,849,418
- Left office at
- $4,188,000,000,000
- Added
- $1,764,000,000,000
- Change
- +189%
- Per day
- $603,696,098
- Left office at
- $2,698,000,000,000
- Added
- $281,000,000,000
- Change
- +43%
- Per day
- $192,334,017
- Left office at
- $934,000,000,000
- Added
- $177,940,000,000
- Change
- +37%
- Per day
- $198,815,642
- Left office at
- $653,000,000,000
- Added
- $121,340,000,000
- Change
- +34%
- Per day
- $59,861,864
- Left office at
- $475,060,000,000
- Added
- $47,860,000,000
- Change
- +16%
- Per day
- $25,376,458
- Left office at
- $353,720,000,000
35John F. Kennedy
Democratic · 1961–1963
- Added
- $16,889,000,000
- Change
- +6%
- Per day
- $16,302,123
- Left office at
- $305,860,000,000
- Added
- $22,900,000,000
- Change
- +9%
- Per day
- $7,837,097
- Left office at
- $288,971,000,000
- Added
- $7,389,000,000
- Change
- +3%
- Per day
- $2,601,760
- Left office at
- $266,071,000,000
- Added
- $236,143,000,000
- Change
- +1048%
- Per day
- $53,401,854
- Left office at
- $258,682,000,000
- Added
- $5,608,000,000
- Change
- +33%
- Per day
- $3,838,466
- Left office at
- $22,539,000,000
- Paid down
- −$5,419,000,000
- Change
- −24%
- Per day
- −$2,655,071
- Left office at
- $16,931,000,000
- Paid down
- −$1,627,000,000
- Change
- −7%
- Per day
- −$1,846,765
- Left office at
- $22,350,000,000
- Added
- $21,061,000,000
- Change
- +722%
- Per day
- $7,207,734
- Left office at
- $23,977,000,000
- Added
- $276,000,000
- Change
- +10%
- Per day
- $188,911
- Left office at
- $2,916,000,000
- Added
- $497,000,000
- Change
- +23%
- Per day
- $182,184
- Left office at
- $2,640,000,000
- Added
- $916,000,000
- Change
- +75%
- Per day
- $553,808
- Left office at
- $2,143,000,000
- Added
- $266,000,000
- Change
- +28%
- Per day
- $182,067
- Left office at
- $1,227,000,000
- Paid down
- −$288,000,000
- Change
- −23%
- Per day
- −$197,125
- Left office at
- $961,000,000
- Paid down
- −$330,000,000
- Change
- −21%
- Per day
- −$225,872
- Left office at
- $1,249,000,000
- Paid down
- −$440,000,000
- Change
- −22%
- Per day
- −$348,652
- Left office at
- $1,579,000,000
- Added
- $0
- Change
- +0%
- Per day
- $0
- Left office at
- $2,019,000,000
- Paid down
- −$89,000,000
- Change
- −4%
- Per day
- −$60,917
- Left office at
- $2,019,000,000
- Paid down
- −$437,000,000
- Change
- −17%
- Per day
- −$149,555
- Left office at
- $2,108,000,000
- Paid down
- −$133,000,000
- Change
- −5%
- Per day
- −$93,727
- Left office at
- $2,545,000,000
- Added
- $2,587,419,000
- Change
- +2856%
- Per day
- $1,721,502
- Left office at
- $2,678,000,000
15James Buchanan
Democratic · 1857–1861
- Added
- $61,881,000
- Change
- +216%
- Per day
- $42,355
- Left office at
- $90,581,000
- Paid down
- −$31,103,000
- Change
- −52%
- Per day
- −$21,288
- Left office at
- $28,700,000
- Paid down
- −$3,650,000
- Change
- −6%
- Per day
- −$3,766
- Left office at
- $59,803,000
- Added
- $391,000
- Change
- +1%
- Per day
- $794
- Left office at
- $63,453,000
- Added
- $47,137,000
- Change
- +296%
- Per day
- $32,263
- Left office at
- $63,062,000
- Added
- $10,674,000
- Change
- +203%
- Per day
- $7,464
- Left office at
- $15,925,000
- Added
- $0
- Change
- +0%
- Per day
- $0
- Left office at
- $5,251,000
- Added
- $4,914,000
- Change
- +1458%
- Per day
- $3,363
- Left office at
- $5,251,000
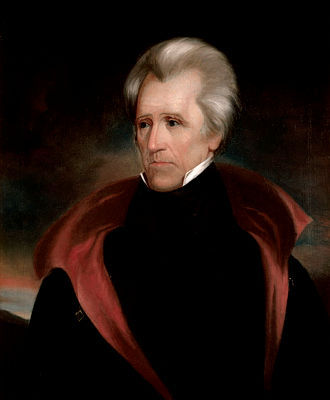
7Andrew Jackson
Democratic · 1829–1837 · Paid the debt down to almost nothing in 1835.
- Paid down
- −$58,084,000
- Change
- −99%
- Per day
- −$19,878
- Left office at
- $337,000
- Paid down
- −$25,367,000
- Change
- −30%
- Per day
- −$17,362
- Left office at
- $58,421,000
- Paid down
- −$39,704,000
- Change
- −32%
- Per day
- −$13,587
- Left office at
- $83,788,000
- Added
- $66,469,000
- Change
- +117%
- Per day
- $22,747
- Left office at
- $123,492,000
- Paid down
- −$26,015,000
- Change
- −31%
- Per day
- −$8,903
- Left office at
- $57,023,000
- Added
- $974,000
- Change
- +1%
- Per day
- $667
- Left office at
- $83,038,000
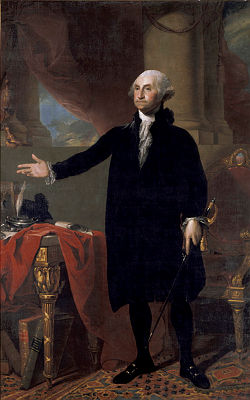
1George Washington
Unaffiliated · 1789–1797 · Debt inherited from the Revolutionary War.
- Added
- $11,003,000
- Change
- +15%
- Per day
- $3,840
- Left office at
- $82,064,000
Total public debt outstanding from the Treasury's Debt to the Penny and Monthly Statement of the Public Debt (Inauguration Day figures from 1977 on, rounded to the nearest $1 billion) and its Historical Debt Outstanding table (the fiscal-year-end total nearest each transfer of office before that, rounded to the nearest $1 million). The sitting president's figures update from the live Treasury feed; the per-second rate is the average over the most recent reporting days.